Testing on a 500 GB / 7-day dataset revealed VictoriaLogs delivered 94% reduction in query latencies, 40% storage compression, and under 50% CPU/RAM versus Loki.
Background
At Truefoundry, we support multi-tenant ML workloads requiring fast ad-hoc search, high ingestion rates, live log tailing, and minimal operational overhead on 4 vCPU / 16 GB RAM nodes. As our scale grew, Loki began showing >30s search latencies and high I/O amplification, prompting us to evaluate alternatives.
System Overviews
Loki
Grafana Labs' log aggregation system uses compressed chunks with label-based indexing and LogQL queries. Its strengths include seamless Grafana integration and a mature ecosystem. However, limitations include expensive full-scan regex searches and Go garbage collection overhead at scale.
VictoriaLogs
VictoriaMetrics' columnar LSM-style log database features per-field indices, SIMD-accelerated search, and SQL-like LogSQL syntax. It offers single-binary deployment with minimal memory footprint and efficient storage compression.
Benchmark Setup
Our testing methodology included:
- Workload: 65 MB/s continuous ingestion via flog generator → Vector → destination
- Dataset: ~500 GB over 7 days across 20 namespaces and 40 applications
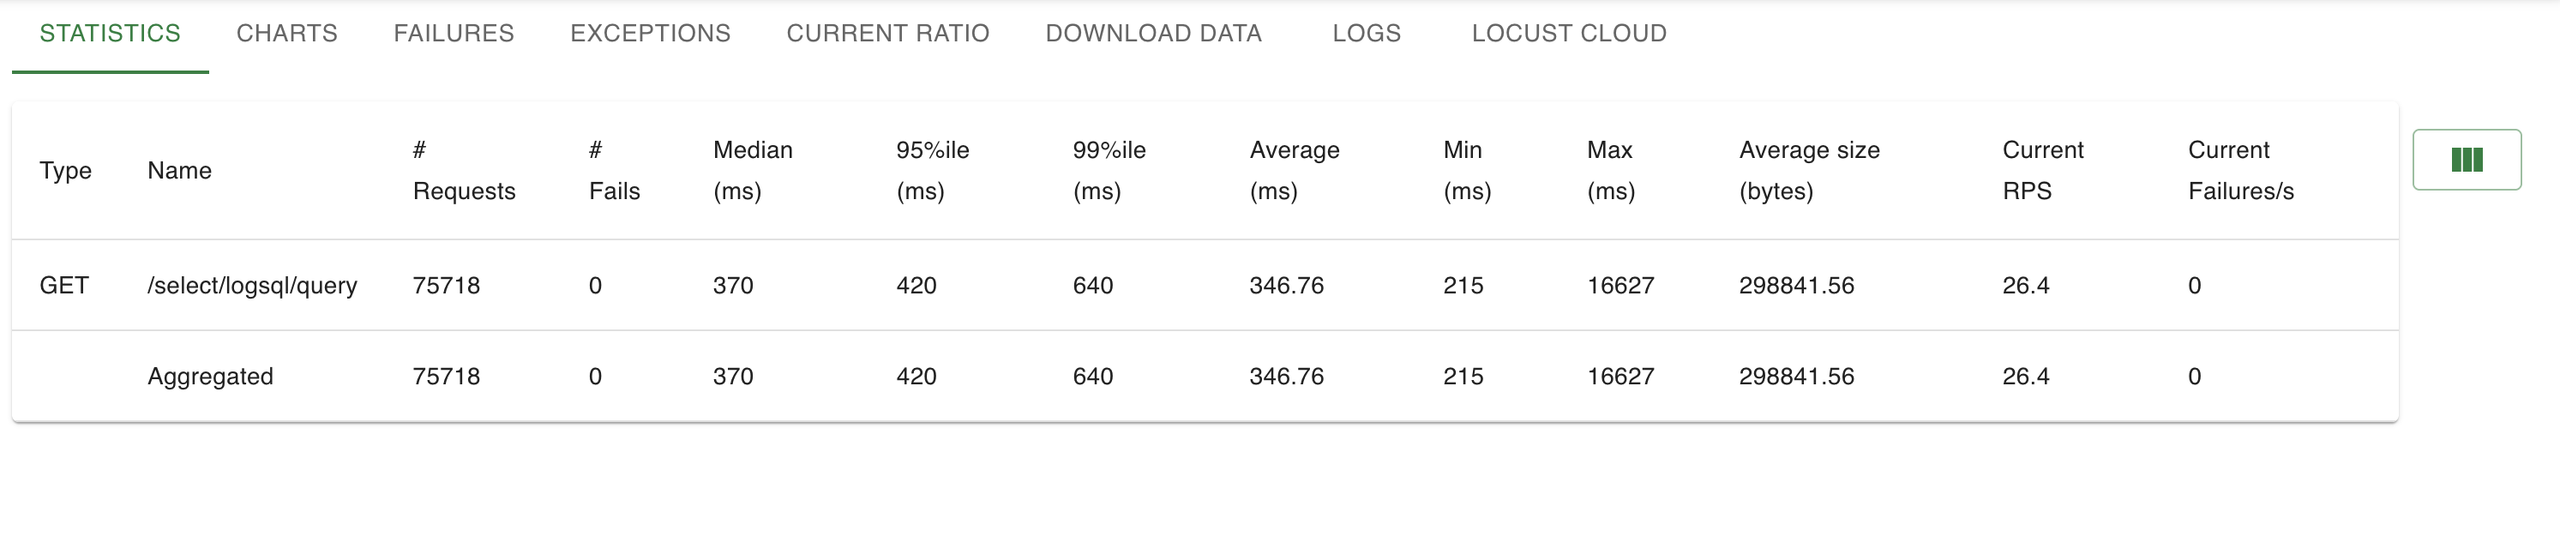
- Load Testing: Locust framework with 10 virtual users generating 43 RPS sustained
- Hardware: 4 vCPU, 8 GiB RAM instances
- Configuration: Block-cache disabled for cold-read simulation
Query Performance Results
We tested four common query patterns to evaluate real-world performance:
| Query Type | Loki | VictoriaLogs | Improvement |
|---|---|---|---|
| Stats (24h count) | 2.5s | 1.5s | 40% faster |
| Needle-in-Haystack (500 GB) | 12s | ~900ms | 12× faster |
| Pattern ":3000" (7d) | 2.2s | 2.2s | Same |
| Non-existent (500 GB) | Timeout | 2.2s | VL completed |
💡Key Insight: VictoriaLogs' per-token index eliminates brute-force line filtering, while Loki must resort to full scans beyond label filters.
Sample Queries
- Stats Query - Counting logs over 24 hours:*
LogQL (Loki):
sum(count_over_time({app="servicefoundry-server"}[24h]))LogSQL (VictoriaLogs):
{app="servicefoundry-server"} | stats count()- Needle in Haystack - Finding specific log entries:*
LogQL (Loki):
{namespace="truefoundry", app!="grafana"} |= "[UNIQUE-STATIC-LOG] ID=abc123 XYZ"LogSQL (VictoriaLogs):
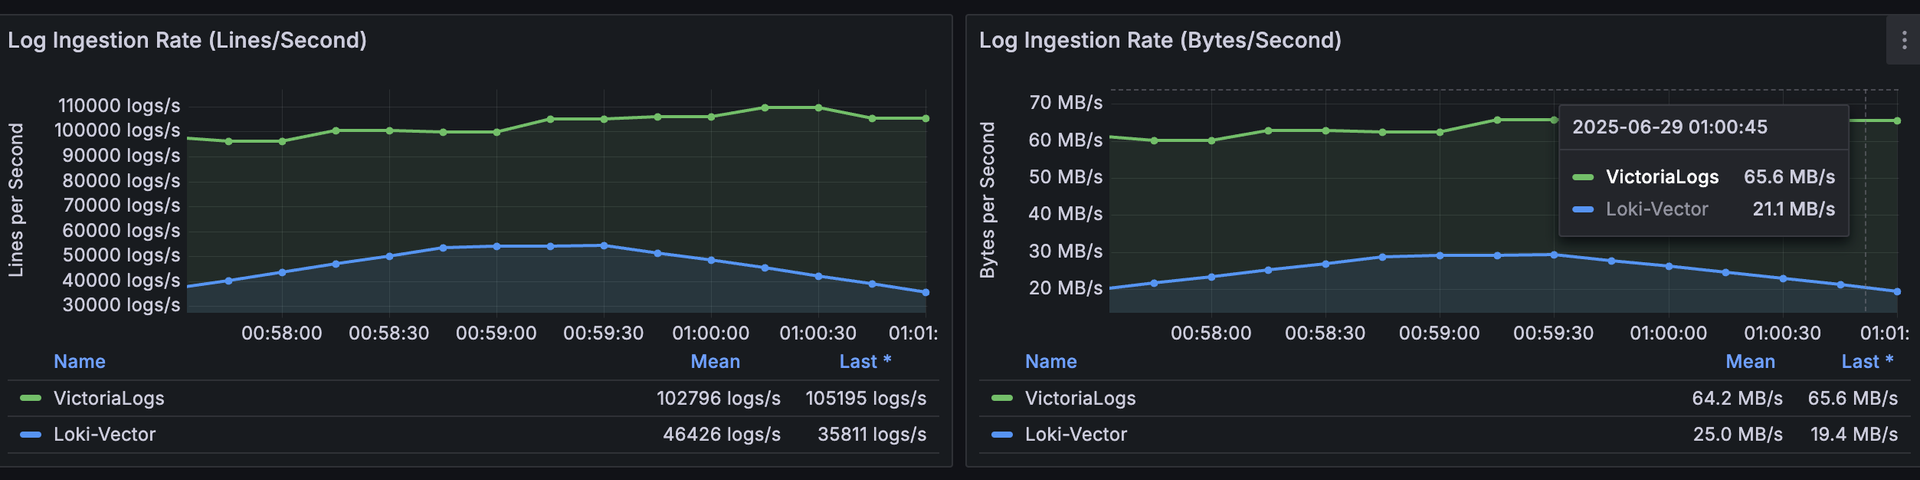
{namespace="truefoundry", app!="grafana"} "[UNIQUE-STATIC-LOG] ID=abc123 XYZ"Ingestion Performance
We stress-tested both systems with 120 flog replicas to measure peak ingestion capacity:
| Metric | Loki | VictoriaLogs | Delta |
|---|---|---|---|
| Peak Ingestion | 20 MB/s | 66 MB/s | 3× higher |
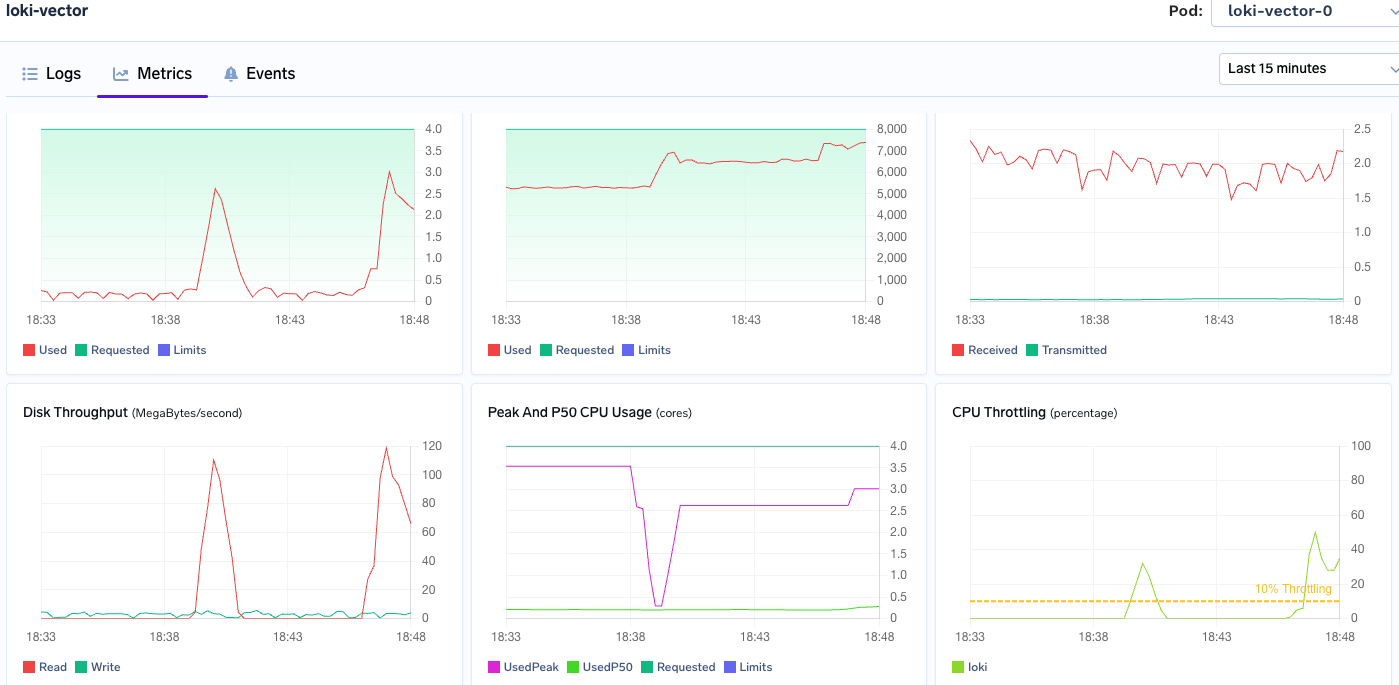
| vCPU Usage | 4 (throttled) | 2 peak | 50% reduction |
| Memory Usage | ~4 GB | ~1.3 GB | 3× lower |
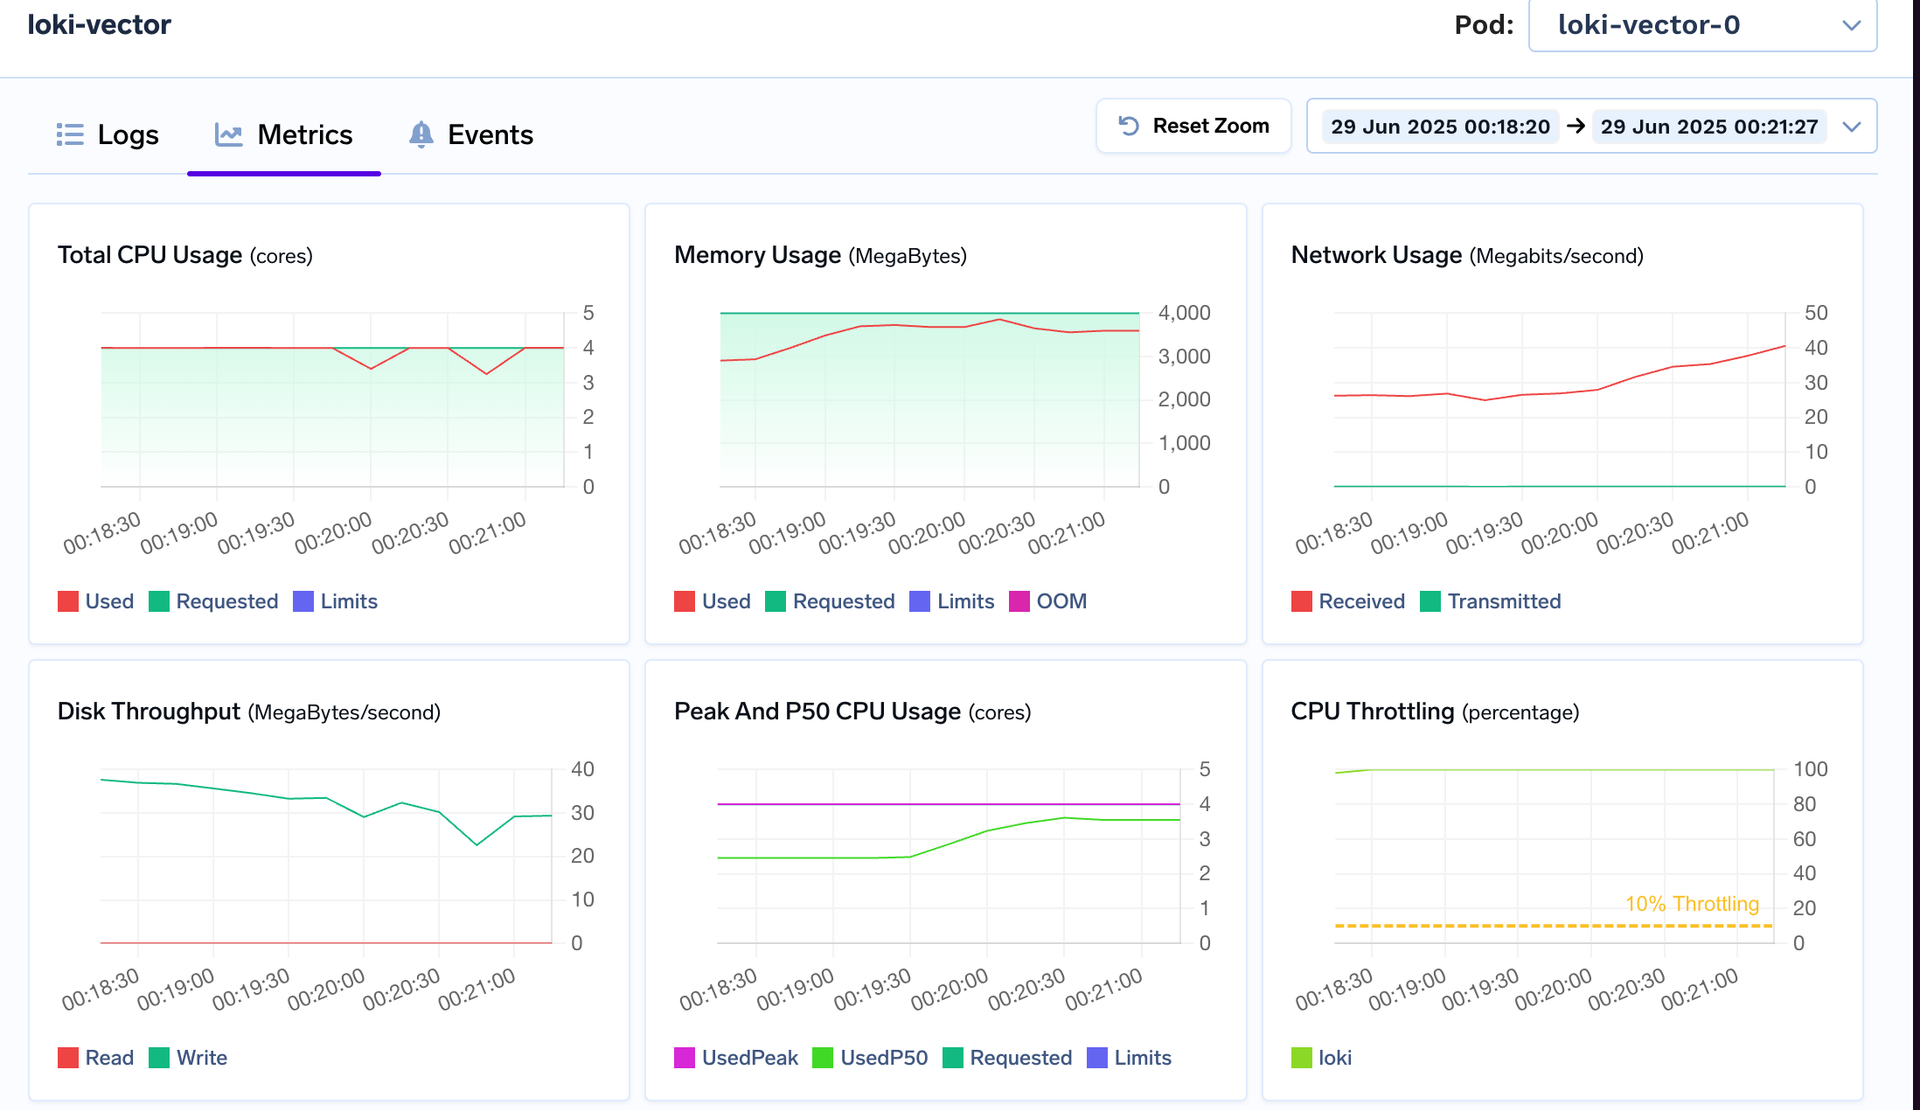
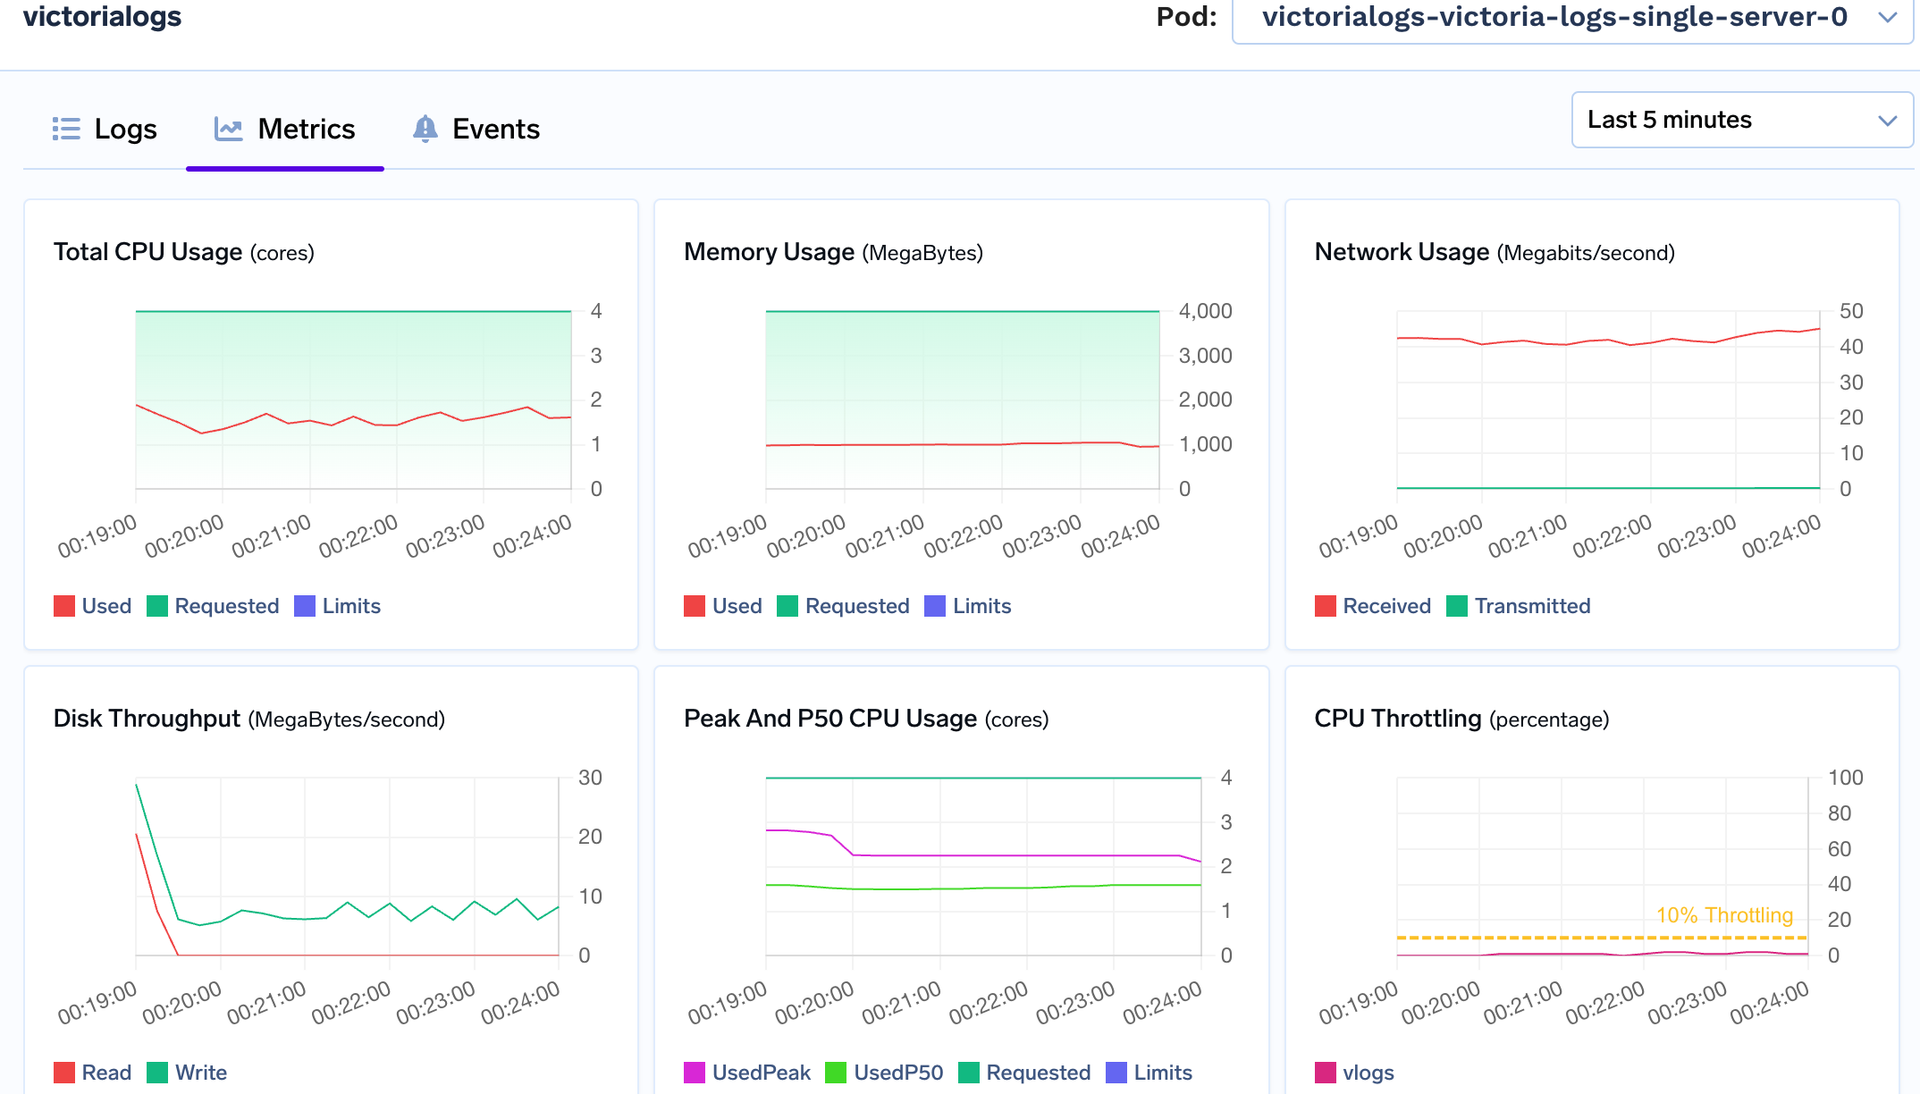
Resource Footprint (7-day retention)
Over the 7-day testing period, we observed significant differences in resource consumption:
| Metric | Loki | VictoriaLogs | Improvement |
|---|---|---|---|
| Storage | 501 GB | 318 GB | 37% smaller |
| Memory (steady-state) | 6–7 GB | 0.6–2 GB | ~70% reduction |
| CPU Peak | 4 vCPU | 1.1 vCPU | 73% lower |
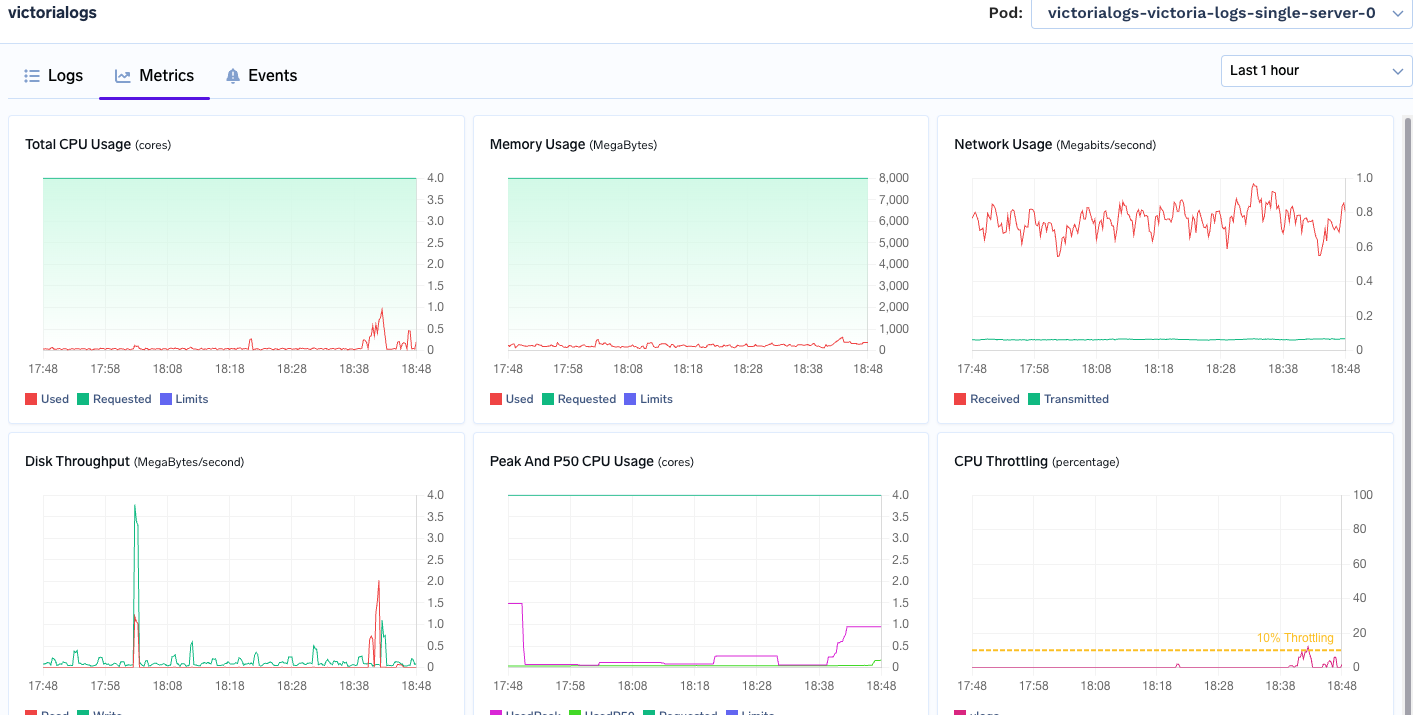
💡Cost Impact: The freed ~2 GB RAM per node enables denser workload scheduling and significant infrastructure cost savings.
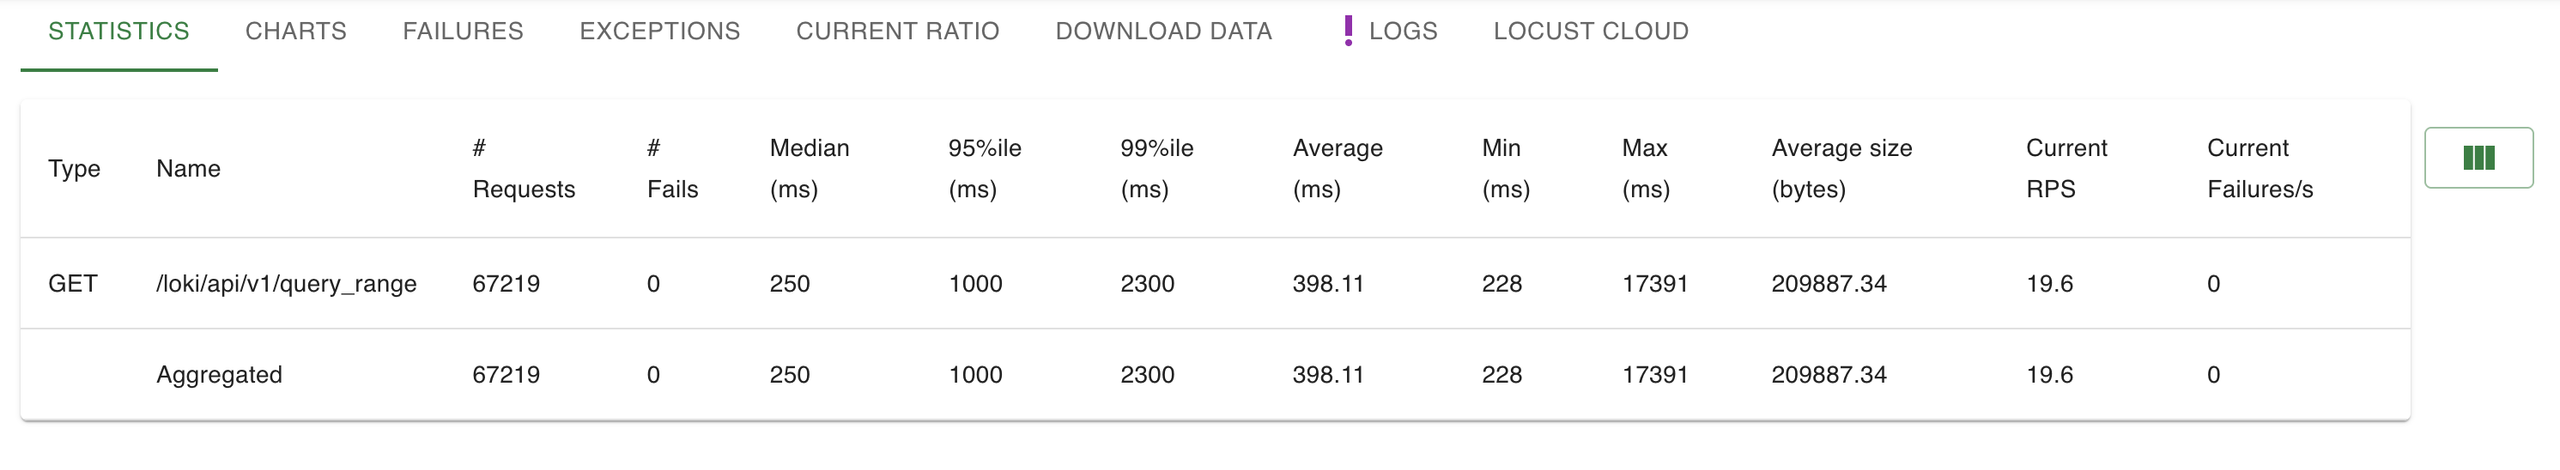
Load Testing Results
Using Locust with 10 concurrent users simulating production traffic, VictoriaLogs demonstrated superior performance:
- RPS Handled: VictoriaLogs processed 36% higher requests per second
- p99 Latency: 3.6× faster than Loki under load
- Tail Latency: Consistently lower across all percentiles
Key Technical Insights
Why VictoriaLogs Outperforms
- Full-text indexing: Per-token indices eliminate expensive line-by-line filtering
- Storage efficiency: Columnar LSM layout reduces disk footprint and I/O seeks
- Memory optimization: Lower overhead enables more efficient resource utilization
- SIMD acceleration: Hardware-optimized search operations provide significant speedups
When to Choose Each System
- Choose VictoriaLogs if:*
- Text search and grep-like queries are primary use cases
- You need fast ad-hoc exploration of logs
- Resource efficiency is critical
- You want minimal operational overhead
- Choose Loki if:*
- Label-based queries dominate your workload
- Deep Grafana ecosystem integration is essential
- You have existing Loki infrastructure and workflows
Conclusion
For text-search-heavy workloads, VictoriaLogs provides order-of-magnitude faster queries and material cost savings. The zero-tuning required approach makes it particularly attractive for teams wanting reliable log search without operational complexity.
- Our benchmarking revealed:
- 94% lower query latencies for full-text searches
- 40% storage compression over 7-day retention
- 50% reduction in CPU/RAM consumption
- 3× higher peak ingestion capacity
Loki remains an excellent choice for label-first queries with tight Grafana integration, but for our use case—fast text search across large log volumes—VictoriaLogs emerged as the clear winner.